Note
Go to the end to download the full example code.
Quasi-geostrophic FTLE ridges time series
Compute a time series of FTLE fields and ridges for the QGE.
# Author: ajarvis
# Data: We thank Changhong Mou and Traian Iliescu for providing us with this dataset
#       and allowing it to be used here.
# Hardware: Intel(R) Core(TM) i7-3770K CPU @ 3.50GHz, Cores = 4, Threads = 8

import numpy as np
from math import copysign
import matplotlib.pyplot as plt
from numbacs.flows import get_interp_arrays_2D, get_flow_2D
from numbacs.integration import flowmap_grid_2D
from numbacs.diagnostics import ftle_from_eig, C_eig_2D
from numbacs.extraction import ftle_ordered_ridges
from scipy.ndimage import gaussian_filter
import time
Get flow data
Load velocity data, set up domain, set the integration span and direction, create interpolant of velocity data and retrieve necessary arrays.
# load in qge velocity data
u = np.load("../data/qge/qge_u.npy")
v = np.load("../data/qge/qge_v.npy")

# set up domain
nt, nx, ny = u.shape
x = np.linspace(0, 1, nx)
y = np.linspace(0, 2, ny)
t = np.linspace(0, 1, nt)
dx = x[1] - x[0]
dy = y[1] - y[0]

# set integration span and integration direction
t0span = np.linspace(0, 0.2, 21)
T = 0.1
params = np.array([copysign(1, T)])  # important this is an array of type float

# get interpolant arrays of velocity field
grid_vel, C_eval_u, C_eval_v = get_interp_arrays_2D(t, x, y, u, v)

# get flow to be integrated
funcptr = get_flow_2D(grid_vel, C_eval_u, C_eval_v, extrap_mode="linear")
Warm-up
Make first call to njit functions to show warm-up time.
# initiate arrays and counter for total time of each function
n = len(t0span)
ftle = np.zeros((n, nx, ny), np.float64)
ridges = []
fmtt = 0
ctt = 0
rtt = 0

# integrate grid of particles from t0span[0] to t0span[0] + T
wu_fm = time.perf_counter()
flowmap = flowmap_grid_2D(funcptr, t0span[0], T, x, y, params)
wu_fm = time.perf_counter() - wu_fm
fmtt += wu_fm

# compute eigenvalues/vectors of Cauchy Green tensor
wu_c = time.perf_counter()
eigvals, eigvecs = C_eig_2D(flowmap, dx, dy)
wu_c = time.perf_counter() - wu_c
ctt += wu_c

eigval_max = eigvals[:, :, 1]
eigvec_max = eigvecs[:, :, :, 1]

# compute FTLE from max eigenvalue
ftle_k = ftle_from_eig(eigval_max, T)
ftle[0, :, :] = ftle_k

# smooth ftle field, usually a good idea for numerical velocity field
sigma = 1.2
ftle_c = gaussian_filter(ftle_k, sigma, mode="nearest")

# set parameters for ridge function
percentile = 50
sdd_thresh = 5e3

# identify ridge points, link points in each ridge in an ordered manner,
# connect close enough ridges
dist_tol = 5e-2
wu_r = time.perf_counter()
ridge_curves = ftle_ordered_ridges(
    ftle_c,
    eigvec_max,
    x,
    y,
    dist_tol,
    percentile=percentile,
    sdd_thresh=sdd_thresh,
    min_ridge_pts=25,
)
wu_r = time.perf_counter() - wu_r
rtt += wu_r
ridges.append(ridge_curves)

print(f"Flowmap with warm-up took {wu_fm:.5f} seconds")
print(f"Cauchy green eigenvalues/vectors with warm-up took {wu_c:.5f} seconds")
print(f"FTLE ridges with warm-up took {wu_r:.5f} seconds")
Flowmap with warm-up took 2.37750 seconds
Cauchy green eigenvalues/vectors with warm-up took 0.03502 seconds
FTLE ridges with warm-up took 0.02028 seconds
Ridge time series
Compute time series of FTLE and FTLE ridges, record times.
ft0 = time.perf_counter()
for k in range(1, n):
    # integrate grid of particles from t0span[k] to t0span[k] + T
    fks = time.perf_counter()
    flowmap = flowmap_grid_2D(funcptr, t0span[k], T, x, y, params)
    fkf = time.perf_counter()
    fmtt += fkf - fks

    # compute eigenvalues/vectors of Cauchy Green tensor
    cks = time.perf_counter()
    eigvals, eigvecs = C_eig_2D(flowmap, dx, dy)
    ckf = time.perf_counter()
    ctt += ckf - cks

    eigval_max = eigvals[:, :, 1]
    eigvec_max = eigvecs[:, :, :, 1]

    # compute FTLE from max eigenvalue
    ftle_k = ftle_from_eig(eigval_max, T)
    ftle[k, :, :] = ftle_k

    # smooth ftle field, usually a good idea for numerical velocity field
    ftle_c = gaussian_filter(ftle_k, sigma, mode="nearest")

    # identify ridge points, link points in each ridge in an ordered manner,
    # connect close enough ridges
    rks = time.perf_counter()
    ridge_curves = ftle_ordered_ridges(
        ftle_c,
        eigvec_max,
        x,
        y,
        dist_tol,
        percentile=percentile,
        sdd_thresh=sdd_thresh,
        min_ridge_pts=25,
    )
    rkf = time.perf_counter()
    rtt += rkf - rks
    ridges.append(ridge_curves)
ftf = time.perf_counter()
ftt = ftf - ft0
print(
    "Full run for FTLE ridges (with warmup)"
    + f" took {fmtt + ctt + rtt:.5f} seconds for {n} iterates"
)
print(
    "Average time for flowmap, CG, and ridges"
    + f" (with warmup) was {(fmtt + ctt + rtt) / n:.5f} seconds"
)
print(
    "Average time for flowmap, CG, and ridges"
    + f" (without warmup) was {(fmtt + ctt + rtt - wu_fm - wu_c - wu_r) / (n - 1):.5f} seconds"
)
print(f"First call to flowmap_grid_2D -- {wu_fm:.5f} seconds (warmup)")
print("Mean time for flowmap_grid_2D -- " + f"{(fmtt - wu_fm) / (n - 1):.5f} seconds (w/o warmup)")
print(f"First call to C_eig_2D -- {wu_c:.5f} seconds (warmup)")
print("Mean time for C_eig_2D -- " + f"{(ctt - wu_c) / (n - 1):.5f} seconds (w/o warmup)")
print(f"First call to ftle_ordered_ridges -- {wu_r:.5f} seconds (warmup)")
print(
    "Mean time for ftle_ordered_ridges -- " + f"{(rtt - wu_r) / (n - 1):.5f} seconds (w/o warmup)"
)
Full run for FTLE ridges (with warmup) took 48.87875 seconds for 21 iterates
Average time for flowmap, CG, and ridges (with warmup) was 2.32756 seconds
Average time for flowmap, CG, and ridges (without warmup) was 2.32230 seconds
First call to flowmap_grid_2D -- 2.37750 seconds (warmup)
Mean time for flowmap_grid_2D -- 2.26097 seconds (w/o warmup)
First call to C_eig_2D -- 0.03502 seconds (warmup)
Mean time for C_eig_2D -- 0.03834 seconds (w/o warmup)
First call to ftle_ordered_ridges -- 0.02028 seconds (warmup)
Mean time for ftle_ordered_ridges -- 0.02298 seconds (w/o warmup)
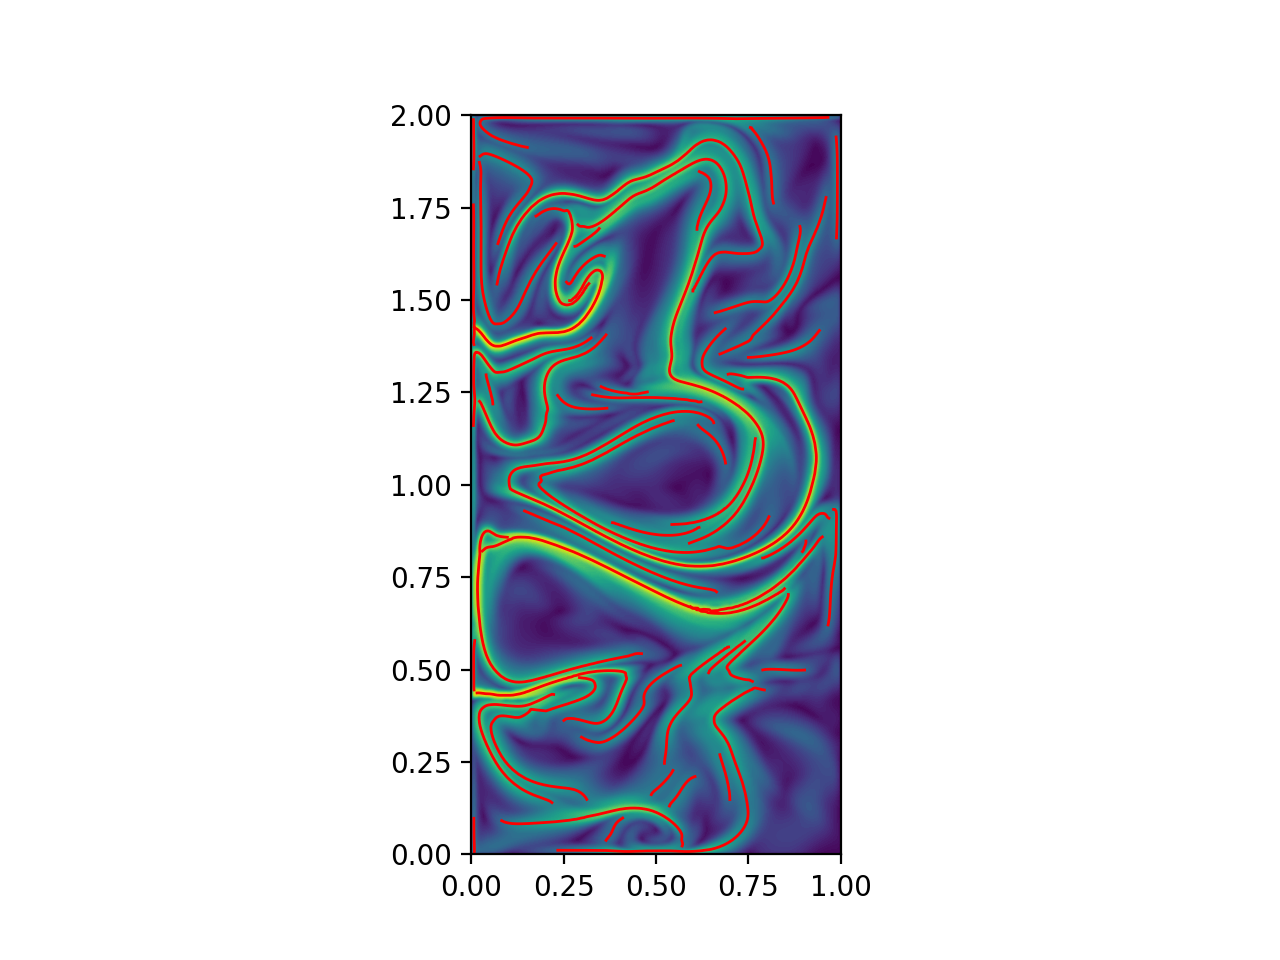
Plot
Plot the results.
fig, ax = plt.subplots(dpi=200)
ax.contourf(x, y, ftle_c.T, levels=80)
for rc in ridge_curves:
    ax.plot(rc[:, 0], rc[:, 1], "r", lw=1.0)
ax.set_aspect("equal")
Total running time of the script: (0 minutes 50.954 seconds)